ggposter builds an A1 (or other true-size) conference poster from ggplot2. A poster is declared as a title band plus columns of rounded, tab-headed cards – text, tables, ggplot2 figures, or photo strips – assembled with grid and gtable and rendered at true size with embedded fonts, including CJK (Japanese). Content and layout can be written as an R list or a YAML file; figures, tables, and photos are supplied separately as R objects.
Three tools build this kind of poster (ggposter, acposter, and qtposter). They do not replace one another – pick the one that fits the job. The three READMEs carry the same sections in the same order.
What you can make
- A true-size poster – A0/A1/A2 (portrait or landscape), written out as PDF or PNG with the fonts embedded, including CJK (Japanese).
- A title band plus cards – each section becomes one rounded, tab-headed card; a card holds text, a table, a ggplot2 figure, or a photo strip, and can pair a table/figure with a bullet-list description.
-
Two ways to place the cards –
layout:(named columns) for the usual poster,grid:(x/y/w/hper card) when a card must span rows or columns. - A spec that stays declarative – content and layout as an R list or a YAML file; figures, tables, and photos are passed in separately as R objects, so the analysis stays in R.
Reference documentation: https://matutosi.github.io/ggposter/
Requirements and installation
You can install the development version of ggposter from GitHub with:
# install.packages("remotes")
remotes::install_github("matutosi/ggposter")
ggposter needs R and draws with grid/gtable, ggplot2, and gridtext; a CJK font is needed only for Japanese text. No LaTeX and no browser are involved – the poster is drawn by R itself.
Usage
The layout below follows a typical conference poster – a full-width title band and a two-column body of rounded, tab-headed cards for introduction/methods/summary on the left and results/conclusions on the right – filled in with the mpg fuel-economy dataset bundled with ggplot2. The title, author, and affiliation are placeholders. It also shows two features for keeping a card’s height tied to what’s actually in it, instead of a fixed proportion of the column: height = "auto" sizes a card to fit its own content, and notes puts a bullet-list description beside a table or figure.
library(ggposter)

source(system.file("extdata", "readme_example.R", package = "ggposter"))
p <- readme_example_poster()
The spec behind it runs to about 140 lines, so it lives in inst/extdata/readme_example.R rather than in this README – the sibling tools keep their samples in files too. readme_example_spec() returns the R list, readme_example_objects() builds the figures and tables it refers to, and readme_example_poster() combines them.
The same layout, theme, title, and section text can live in a YAML file instead of an inline R list, keeping the declarative content separate from the R code. Only the figures and tables stay in R, passed in via objects (reusing the same objects built above); image paths in the spec resolve relative to the YAML file’s own directory. p_yml below is identical to p above:
yml_path <- system.file("extdata", "poster_readme_example.yml", package = "ggposter")

p_yml <- poster(yml_path, objects = readme_example_objects())
Rendering a poster at true size makes font sizes and spacing come out correctly proportioned; previewing it at an arbitrary plot size (as this README does) does not, so we render a scaled-down preview PNG instead of printing p directly:
render_poster(p, "man/figures/README-poster-preview.png", scale = 0.3, dpi = 150)
knitr::include_graphics("man/figures/README-poster-preview.png")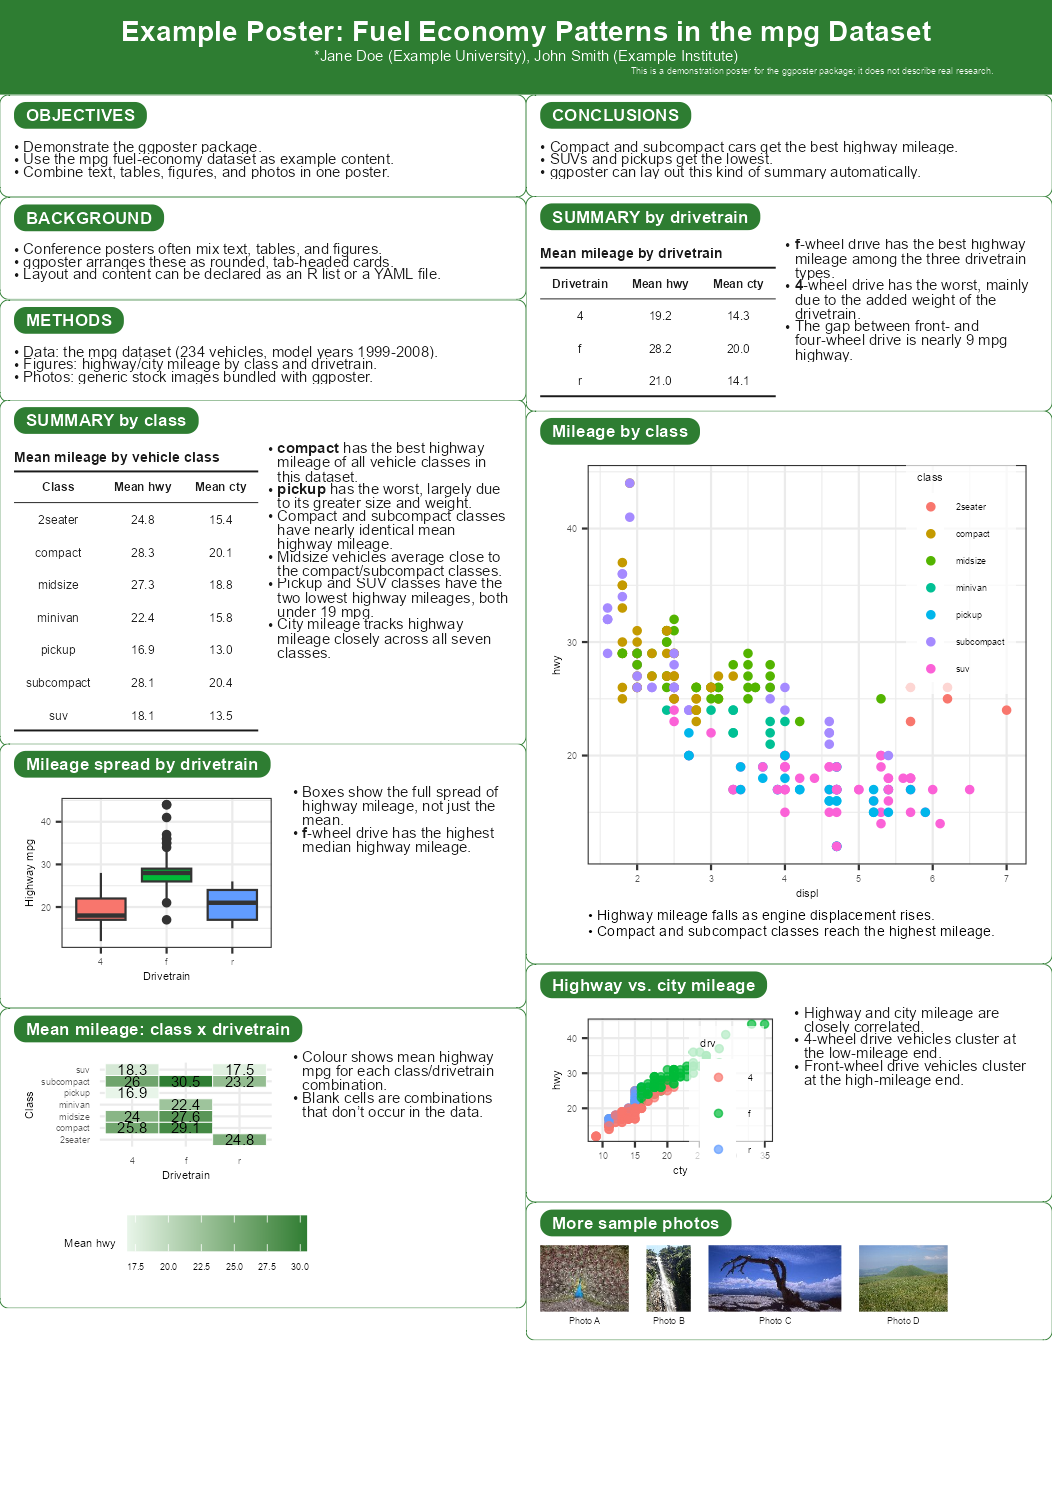
Seeing each card’s plot area
Passing show_plot_area = TRUE to render_poster() outlines every card’s header tab and body – the area its text, table, figure, or photo strip actually occupies – with a dashed border, on top of the content. A table/figure paired with a bullet-list description gets two separate borders, one for each side, rather than one around the pair. It’s an output option, so the same poster p renders both the normal version above and the outlined version below – useful for checking exactly how much of a card each of its parts fills:
render_poster(p, "man/figures/README-poster-preview-plot-area.png",
              scale = 0.3, dpi = 150, show_plot_area = TRUE)
knitr::include_graphics("man/figures/README-poster-preview-plot-area.png")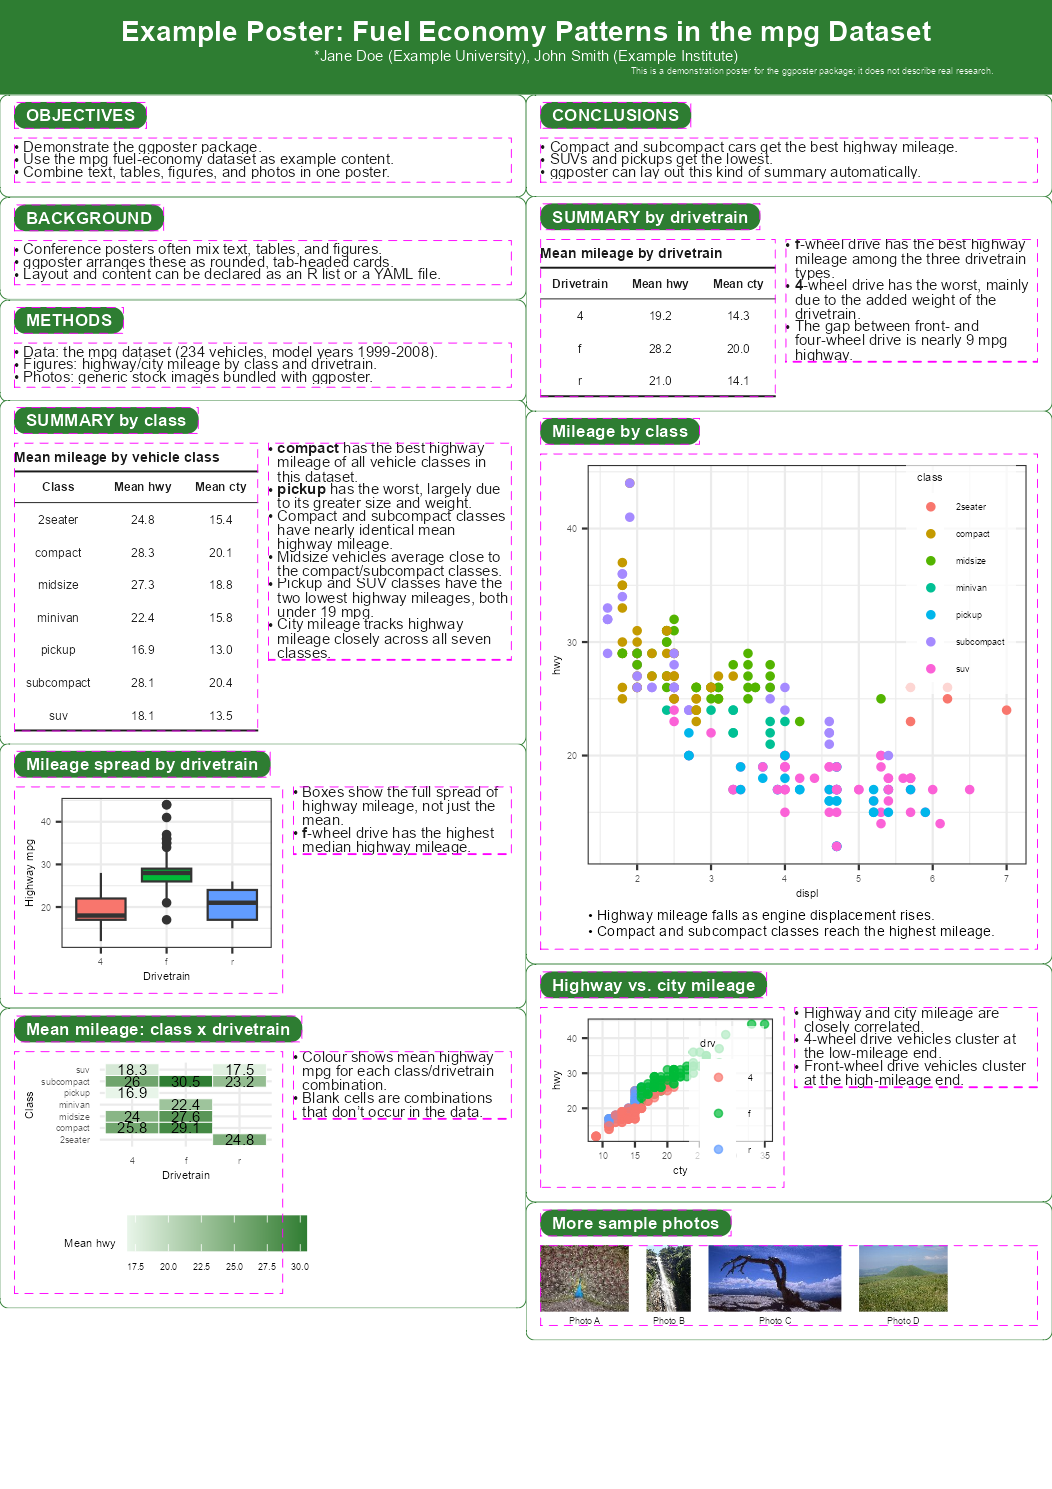
Save it at true size, with fonts embedded:
render_poster(p, "poster.pdf")                            # true A1 size
render_poster(p, "preview.png", scale = 0.25, dpi = 150)   # A4-ish preview
See vignette("ggposter") for the full spec schema, theming, and a reproduction of a real conference poster.
Writing the spec
A spec has four parts: title (the band), poster (paper size and orientation), theme (type size, family, accent colour), and sections (the cards). Each section has a header, an optional relative height (or "auto" to fit its own content), and a body of one of four types:
body$type |
What it draws | Where the content comes from |
|---|---|---|
text |
paragraphs and bullet lists |
md, a character vector |
table |
a table, optionally with notes beside it |
object, a data frame |
figure |
a ggplot2 figure, optionally with a caption below |
object, a ggplot |
image |
a labelled photo strip |
files, image paths |
The metadata may also be written flat, the way the sibling tools write a header (see “Sharing with the sibling tools” below). See vignette("ggposter") for the full schema.
Layout
Without layout or grid, a top-level columns count flows the sections down the leftmost column and on into the next, in the order written.
layout:                        # named columns; each is a stack, top to bottom
  align_rows: true
  left:  [objectives, methods]
right: [results, summary]grid: # coordinates; 0-based, w/h default to 1
columns: 3
boxes:
- {name: objectives, x: 0, y: 0, w: 2}
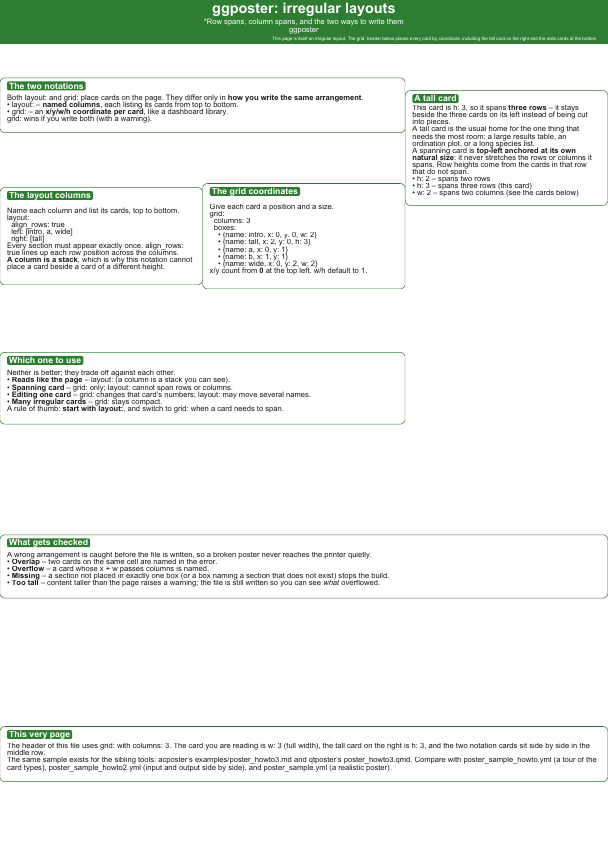
- {name: results, x: 2, y: 0, h: 3}grid wins if both are given (with a warning). Overlapping boxes, boxes running past columns, and any section not placed exactly once raise an error; content taller than the page raises a warning. grid: is written identically in all three tools, so an arrangement carries across unchanged; layout: does not (it names columns here and is a row-by-row matrix in acposter).
Samples
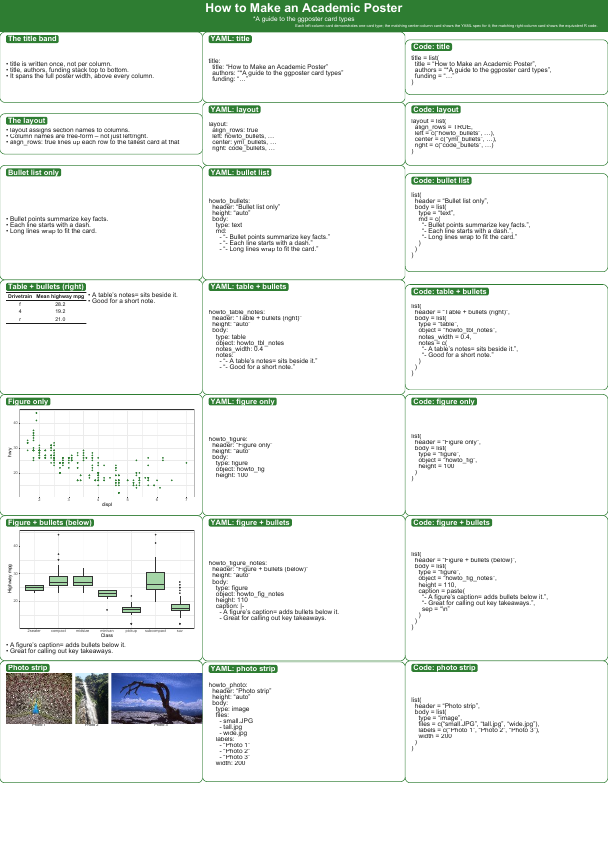
Four samples ship with the package.
| Sample | What it shows | |
|---|---|---|
| 1 | inst/extdata/poster_sample_howto.yml |
a tour of the card types |
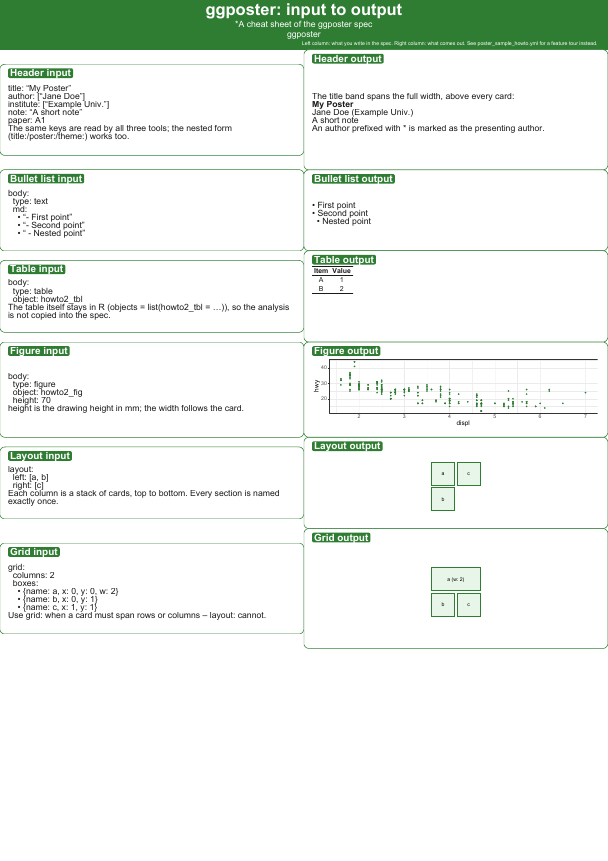
| 2 | inst/extdata/poster_sample_howto2.yml |
input and output side by side |
| 3 | inst/extdata/poster_sample_howto3.yml |
irregular layouts (grid:) |
| 4 | inst/extdata/poster_sample.yml |
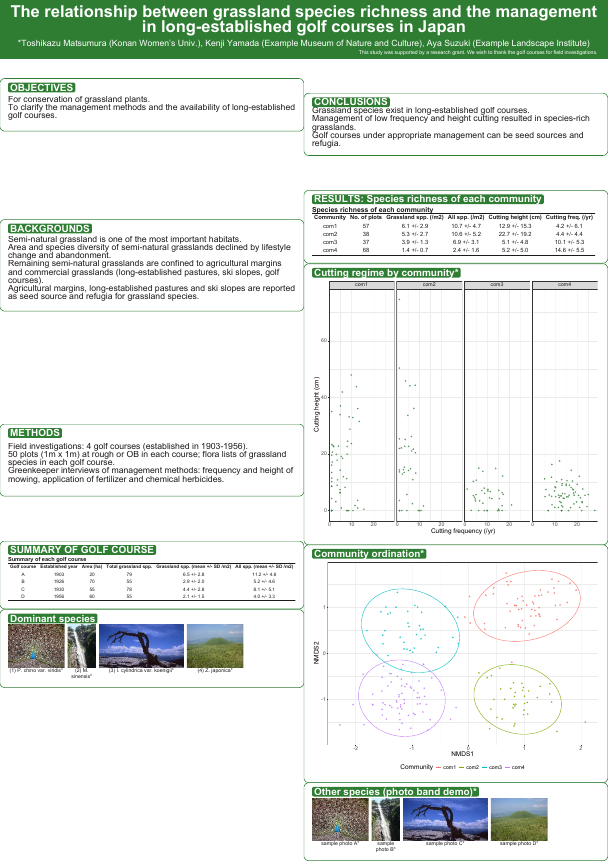
a realistic poster (fictional data) |
source(system.file("extdata", "render_samples.R", package = "ggposter"))
render_ggposter_samples(out_dir = ".")
Scaled-down previews (click an image for its spec).
| 1. A tour of the card types | 2. Input and output side by side |
|---|---|
 |
 |
3. Irregular layouts (grid:) |
4. A realistic poster |
|---|---|
 |
 |
The images are made from the rendered PDFs with pdftoppm -r 26 -png <file>.pdf man/figures/README-sampleN, the way acposter and qtposter make theirs. They sit under man/figures/ rather than previews/ because that is the directory pkgdown copies to the reference site.
poster_sample_flat.yml (a flat header) and poster_readme_example.yml are in the same directory.
Sharing with the sibling tools
ggposter has two siblings that build the same kind of poster by other routes: acposter (build-poster-pdf: Markdown -> pandoc -> headless Chrome) and qtposter (Quarto -> Typst). Those two write their metadata flat, at the top level of the header, while ggposter groups it into title/poster/theme blocks. Both forms are read here, and the names the three tools use for the same thing are folded into the right block, so one header serves all three unchanged:
title: "One header, three poster tools"
author: ["*A. One", "B. Two"]     # authors, poster-authors
institute: ["Example Univ."]      # institutes, affiliation(s)
note: "Fictional sample."         # funding, footer
paper: A1                         # -> poster$size
orientation: portrait
columns: 2                        # -> an equal-share layout
font-size: 22                     # -> theme$base_size
font: "Noto Sans"                 # -> theme$base_family
type: "Academic poster" # only acposter needs it; ignored here| Meaning | ggposter’s own key | Also accepted |
|---|---|---|
| subtitle | title$subtitle |
subtitle (flat) |
| authors | title$authors |
author, authors, poster-authors
|
| affiliations | title$affiliations |
institute, institutes, affiliation
|
| note | title$funding |
note, funding, footer
|
| logo | title$logo |
logo (flat) |
| paper | poster$size |
paper |
| orientation | poster$orientation |
orientation (flat) |
| columns |
columns (top level) |
cols |
| type size | theme$base_size |
font-size, font_size
|
| font | theme$base_family |
font, font-family, font_family
|
| CJK font | theme$cjk_family |
cjk-family |
| accent colour | theme$accent |
accent (flat) |
A top-level columns count stands in for layout when neither layout nor grid is given: the sections flow down the leftmost column and on into the next, in the order written. A list of authors or institutes is joined into the single line the title band draws. Setting the same thing twice – a key and its alias, or the flat and the nested form – keeps ggposter’s own and warns. Nested specs are untouched, and the two forms can be mixed.
A bare size is not accepted: qtposter means type size by it and a spec here means paper, so write font-size or paper.
inst/extdata/poster_sample_flat.yml is a complete poster written this way, next to poster_sample.yml in the nested style. For layout, grid: is written identically in ggposter and acposter, so it carries across unchanged; layout: does not – it names columns here and is a row-by-row matrix there.
Files
| Path | What is in it |
|---|---|
R/ |
the package: poster(), render_poster(), cards, theme, YAML reader |
inst/extdata/ |
the four samples, and render_samples.R to build them |
inst/extdata/readme_example.R |
the spec and objects behind this README’s example poster |
man/figures/ |
the images this README shows, including the four sample previews |
vignettes/ggposter.Rmd |
the full spec schema, theming, a real poster |
tests/testthat/ |
the test suite |
.github/workflows/ |
CI: R CMD check (Ubuntu, macOS) and a build of the four samples |
Status and background
ggposter draws the poster in R itself, so it suits a poster whose figures and tables come straight out of an analysis: the spec stays declarative while the data work stays in R. Sizes are controlled in mm, and the output is a true-size PDF or PNG with the fonts embedded.
CI runs R CMD check on Ubuntu and macOS and builds the four samples on every push (.github/workflows/test.yml); the pkgdown site is deployed from main.
License
MIT (LICENSE).