Draw layer construction plot
Add mid point and bin width of layer heights.
Compute mid point of layer heights.
Compute bin width of layer heights.
Usage
draw_layer_construction(
  df,
  stand = "stand",
  height = "height",
  cover = "cover",
  group = "",
  ...
)

add_mid_p_bin_w(df, height = "height")

mid_point(x)

bin_width(x)Value
draw_layer_construction() returns gg object, add_mid_p_bin_w() returns dataframe including mid_point and bin_width columns. mid_point() and bin_width() return a numeric vector.
Examples
library(dplyr)
n <- 10
height_max <- 20
ly_list <- c("B", "S", "K")
st_list <- LETTERS[1]
sp_list <- letters[1:9]
st_group <- NULL
sp_group <- rep(letters[24:26], 3)
cover_list <- 2^(0:4)
df <- gen_example(n = n, use_layer = TRUE,
height_max = height_max, ly_list = ly_list,
st_list = st_list, sp_list = sp_list,
st_group = st_group, sp_group = sp_group,
cover_list = cover_list)
#> Joining with `by = join_by(stand)`
#> Joining with `by = join_by(stand, layer)`
#> Joining with `by = join_by(species)`
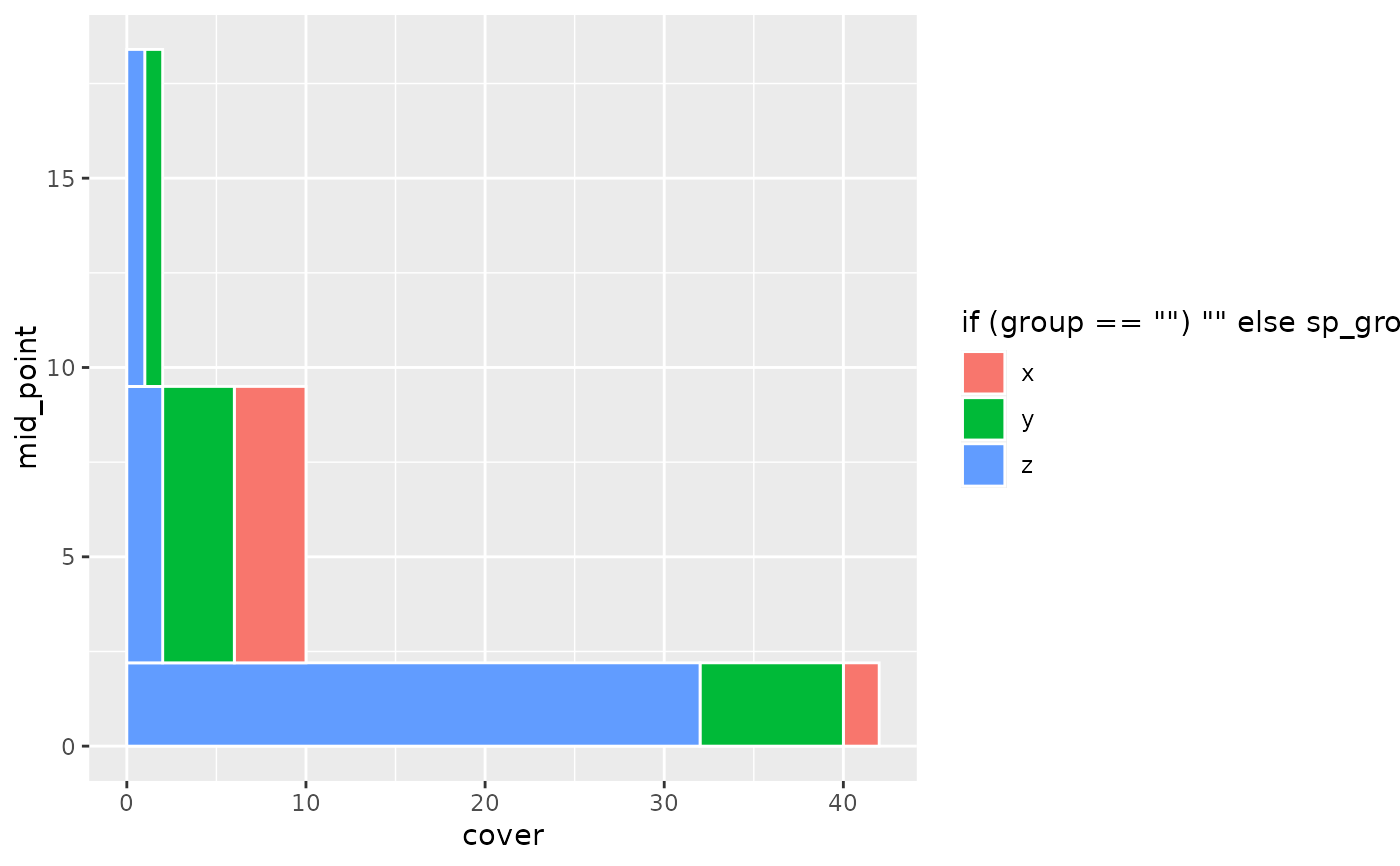
# select stand and summarise by sp_group
df %>%
dplyr::group_by(height, sp_group) %>%
dplyr::summarise(cover = sum(cover), .groups = "drop") %>%
draw_layer_construction(group = "sp_group", colour = "white")
#> Joining with `by = join_by(height)`